Tutorial steps
These notes are intended to show how to use the Access report wizard.
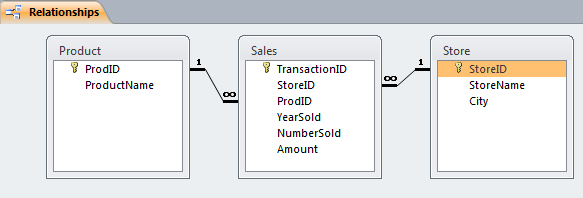
The first step is to make sure relationships are set properly between all the tables you will be using to make your report. The following image shows the relationship diagram used for the sample report we are about to create.
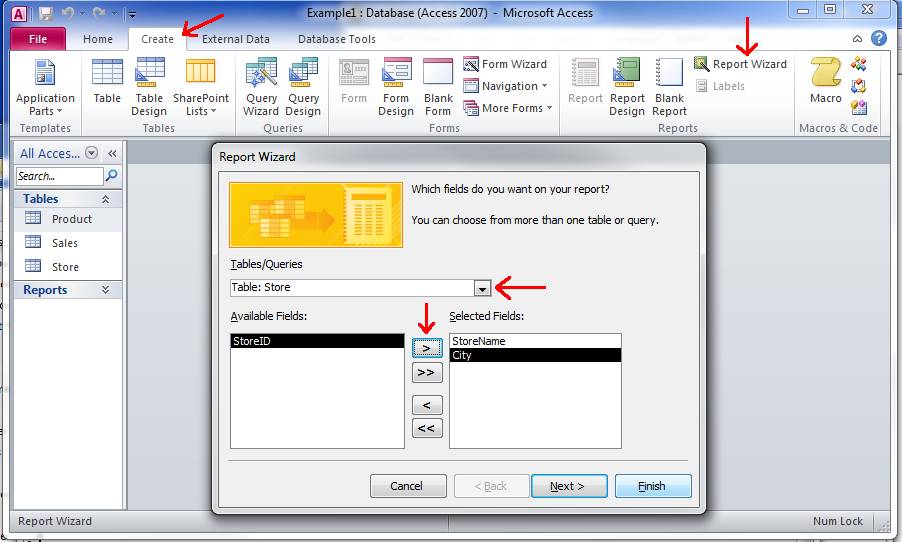
The next step is to start the Report Wizard. You can click on the Create tab of the ribbon and then click on the Report Wizard icon. In the report Wizard dialog box that pops up, you select the tables and queries you want to include in the report using the Tables/Queries drop down list box. For each table and query you want to use, you then select the fields you want from the Available Fields list and click on the right arrow to move it to the Selected Fields list. If you accidentally include a field you don't want, you can remove it from the Selected Fields list by selecting it there and using the left arrow button to remove it.
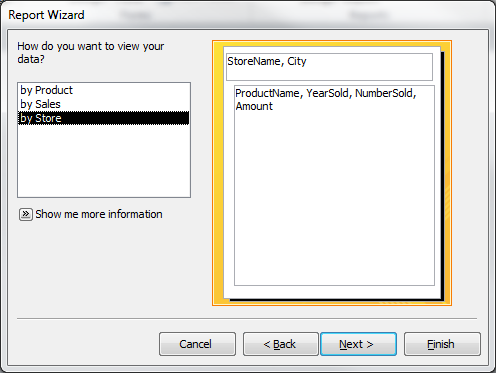
Once you have selected all the fields you want to use, you can then select grouping for your data. In this case we want to view the data grouped by store.
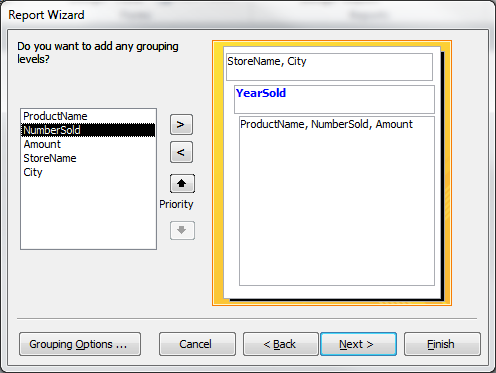
In some cases, you might want an additional grouping level. You can select the field you want to group by on the left side and then use the right arrow to add that grouping level. You can also change which grouping is the primary grouping using the up and down arrow buttons.
The next dialog allows you to specify sort order. Notice the Summary Options button at the bottom. That's how you can specify which fields should include totals in the report.
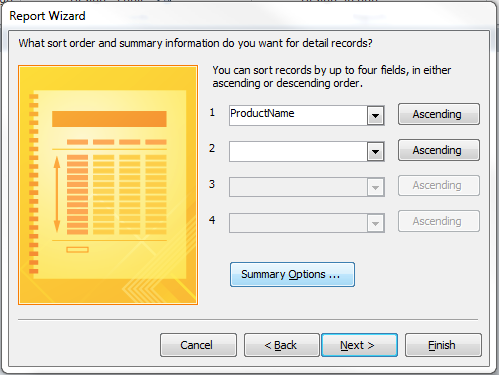
The image below shows the Number Sold and Amount fields being selected for getting group totals on the report.

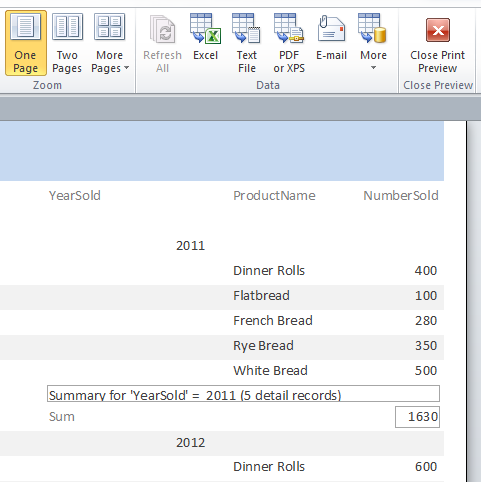
The following image shows what the report would look like in Print Preview view. This report only shows the sum for the Number Sold field. If a field is filled with # signs, then you will have to go to design view and widen the field. The # signs indicate that there is not enough width in the field to display the data.
The following image shows the report in design view. You can click on items in design view to delete them, move them, or resize them. You can click inside labels to change their text. If you delete fields and drag them upward in one section, then you can shorten the length of that section by clicking and dragging upward on the top edge of the gray bar that represents that section. Switch back to Report View to see what the changes will look like on the final report.

The following image shows what the finished report looks like.
